In a new analysis, my colleagues and I at UCL showed that common genetic variation affecting apolipoprotein E (apoE) is responsible for about three-quarters of late-onset Alzheimer’s disease (AD).1 Moreover, we think three-quarters is an underestimate. The findings imply that if we could eliminate the detrimental effects of apoE in the population we would prevent most AD from occurring. So what led us to this eye-popping proportion, how do we interpret it and, given apoE’s long association with AD, why isn’t this molecule’s primacy in the aetiology of the disease widely recognised yet?
First, let’s start with a brief primer on apoE. This protein has a very prominent role in cholesterol transport in the periphery, but it is also highly expressed and has numerous roles in the central nervous system. In humans, three common forms of the protein exist as a result of genetic variation at two sites in the APOE gene. These isoforms are known as ε2, ε3 and ε4. ε3 is the most common isoform: about 95% of the UK population have inherited at least one copy of the gene that makes it, and about 60% have inherited two copies and therefore make ε3 proteins exclusively. ε4 is the next most common isoform, with about 29% of the UK population carrying at least one copy of the gene that makes it, whilst about 2.5% carries two copies. The least common isoform is ε2, with about 15% of the UK having at least one copy of its gene, whilst 0.6% of the population makes ε2 exclusively.
The ε4 isoform is well known to dementia researchers; the genetic variant responsible for it is typically referred to as the strongest genetic risk factor for late-onset AD. Among individuals of European ancestry, individuals who make a mix of ε3 and ε4 proteins have approximately 3 times greater odds of developing AD, relative to people making only ε3 proteins.2 Individuals making exclusively ε4 have something in the region of a whopping 12 times’ greater odds of developing AD. In terms of absolute risk – that is, how likely a person is to develop AD in his or her lifetime – individuals making ε3 exclusively have about a 10% chance of developing AD by age 85, and those making only ε4 have in the region of a 60% chance.3 Conversely, relative to individuals who make only ε3, people who make one or two copies of the ε2 protein have much lower risk of AD. This has led to ε2 being labelled as protective with respect to AD risk. Individuals making ε2 in one or two doses have less than a 6% lifetime chance of developing the disease.3
ApoE ε3 confers considerable risk of AD to almost everyone
But here we arrive at what must be one of the biggest oversights in dementia research. Since individuals making only ε3 proteins are positioned in the middle of a risk scale for AD – between individuals who are making ε2 proteins (at lower risk) and others who are making the ε4 protein (at higher risk) – the ε3 protein is very often regarded as neutral in relation to AD. This view is incorrect. It is akin saying that moderate smoking in the population contributes nothing to the burden of lung cancer, since non-smoking and heavy smoking influences risk of lung cancer in either direction. This misperception has probably been compounded by the view that if ε3 is so common, it cannot be harmful.
Regarding ε3 as neutral between the opposing effects of ε2 and ε4 is only a matter of perspective. If we shift our view to that of individuals who make only ε2 proteins, anyone else exposed to ε3 appear to have precarious positions in terms of AD risk. In a case-control study where AD cases had neuropathological confirmation upon autopsy, relative to our lucky few individuals making only ε2 proteins, those making ε3 proteins exclusively had 7.7 times greater odds of AD.4 Whether this heightened risk owes to ε3 being more detrimental for AD pathogenesis or because ε3 lacks some protective property of ε2 is not an important distinction here. Either way, ε3 is increasing risk, relative to an alternative which is better (at least in terms of AD risk). And not only does ε3 confer considerable risk of AD, but it also does so very pervasively in populations because it is so common (recall that approximately 95% of the UK population have at least one gene that makes ε3).
So what if we were to look at the burden of AD in the population attributable not only to ε4, but also to ε3? What proportion of the disease occurs in the UK because of these two differences in a single protein?
This is where our analysis comes in.
Measuring the impact of the ε4 AND ε3 proteins on AD burden
We conducted a cohort study in an extremely large population-based resource called UK Biobank, which has genetic information on half a million individuals from England, Scotland and Wales. These participants were recruited between 2006 and 2010, then aged 39-73 years old. In our research, we used data from a subset of the cohort who were aged 60 or older at recruitment (171,128 participants) in order to focus only on people who had appreciable risk of AD throughout the subsequent years since joining the study. We ascertained whether people developed AD over the years since recruitment by confidentially examining whether AD was coded in their health records or in death registration data until late 2023, which gave us 12 to 17 years of follow-up.
We looked at the excess risk of AD among anyone producing ε3 or ε4 proteins (99.4% of the sample). Our reference group consisted of the 1053 individuals who make ε2 exclusively (0.6% of the sample). On average, individuals making any combination of ε3 or ε4 were almost four times more likely to have been diagnosed with AD in the follow-up period. From the prevalence of ε3 and ε4 (i.e. how common they are) and the excess risk among individuals exposed to these two isoforms, we can calculate the proportion of AD attributable to them, which yielded 74%. To reiterate, this implies that if we had the means to eliminate the excess risk conferred by ε3 and ε4 to people – with therapeutics, for example – we would expect to prevent about three-quarters of AD from arising in the population. Or put differently, if everyone in the UK only made ε2 instead of ε3 or ε4 isoforms, three-quarters of AD would not occur.
By extending our calculations, we are also able to partition this proportion roughly into contributions from ε3 and ε4 separately. We estimated that ε4 is responsible for about 45% of AD, with the remaining 30% of disease burden attributable to ε3 specifically. So almost a third or more of AD is arising due to the existence of ε3 – not exactly innocuous!
There are various limitations to our study, but the most prominent of these all relate to our incomplete ascertainment of AD diagnoses. Looking at clinical codes among health records misses many cases, and UK Biobank participants haven’t lived their whole lives yet – unfortunately, many more among our sample will develop AD in their lifetimes. Since we know that apoE isoforms affect AD risk, our missing ascertainment will be disproportionately worse among individuals making ε3 and ε4 and less so among people making ε2 exclusively (since, proportionately, much fewer of them get AD). Since we do not have neuropathological confirmation of AD for cases, we also suspect some cases in our sample may have had other forms of dementia and been misclassified – which would weaken the link between apoE and AD that we observe. These are among the reasons why we think 74% is probably an underestimate. To add more context, in some review articles from 2004, an astute clinician called John Wesson Ashford at Stanford University highlighted the circumstances I describe here, and he and colleagues estimated that up to 95% of all AD may be attributable to ε3 and ε4.5,6
So to summarise, our findings show that if we had the means to target apoE directly, or by modulating factors on the pathway from the protein to AD pathogenesis, we could prevent most AD from occurring.
So is apoE a cause, THE cause, or the predominant cause of AD?
Though our modelling, results and conclusion here are simple, interpretation is not always straightforward. For instance, if ε3 and ε4 are causing most AD, why don’t all individuals with these isoforms develop AD within their lifetimes? Recall the lifetime risk estimates that I provided earlier: only ~10% of people who make ε3 exclusively develop AD, and even among individuals exclusively making ε4, a large minority (in the region of 40%) may not develop AD in their lifetimes.
Thankfully, apparent paradoxes like this can be resolved by understanding the nature of complex diseases with multiple causes, i.e. multifactorial disease. In epidemiology, we think about this concept in terms of a spectrum of risk for a disease (which we refer to as liability). Somewhere on this spectrum is a threshold that if crossed, an individual will develop the disease in question. An individual will occupy a position on this scale as a combination of many factors (genetic and environmental) that affect risk throughout his or her life. If all combined risk leaves someone below the threshold, the disease does not occur for them, whereas if their total risk positions them above the threshold, bad news will be forthcoming.
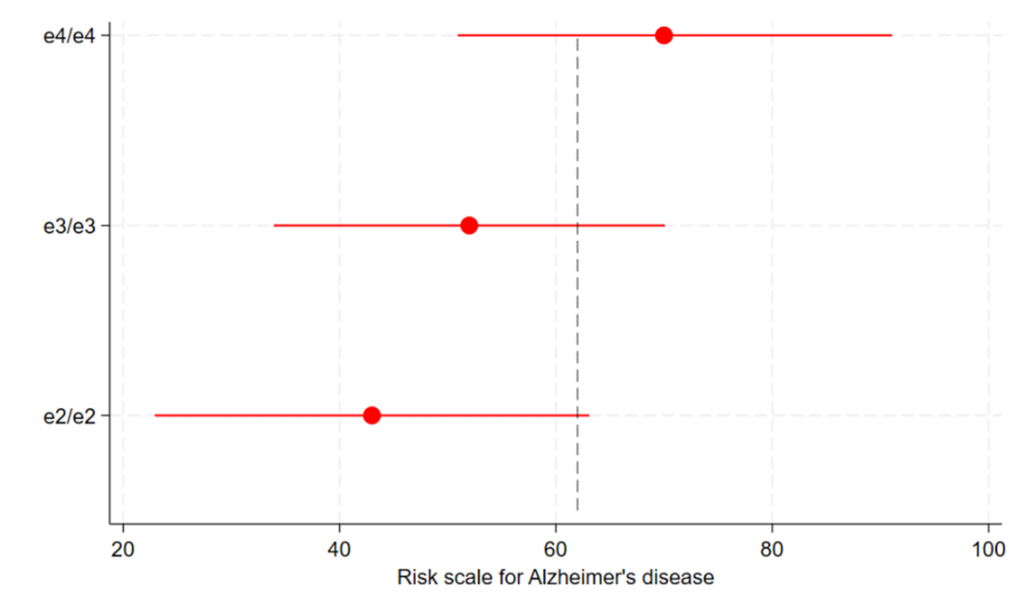
In the case of apoE isoforms and AD, an average individual producing ε3 or ε4 is much higher up the risk spectrum, and hence much closer to the threshold for disease, than an average individual making only ε2 (Figure 1). So it takes fewer other contributing factors to go against them before they cross the threshold. However, despite the relative disadvantage that individuals with ε3 or ε4 experience with their positions on the spectrum, there is a large range of positions that individuals can occupy on the risk scale due to differences in the multitude of other contributing causes. Many individuals making ε3 and ε4 won’t reach the threshold despite having heightened risk, and they remain unscathed.

Figure 1: depicting a risk scale (liability) for AD among ε2,ε3 and ε4 homozygotes
Red markers indicate means and ranges of AD risk for three groups of people (with ε2/ε2, ε3/ε3 and ε4/ε4 genotypes). The grey dashed line indicates the threshold of risk needed to develop AD. Note that the different positions of the means and ranges lead to large differences in proportions within groups above the threshold for AD. So if we shift people with ε3 or ε4 down the scale using interventions to block the detrimental effects of these isoforms, far fewer people will develop AD among these groups. NB: units of the risk scale and the position of the threshold are arbitrary, though proportions of individuals above the threshold roughly reflect lifetime risks of AD in individuals with ε4/ε4 (~60%), ε3/ε3 (~10%) and ε2/ε2 (<6%) genotypes.
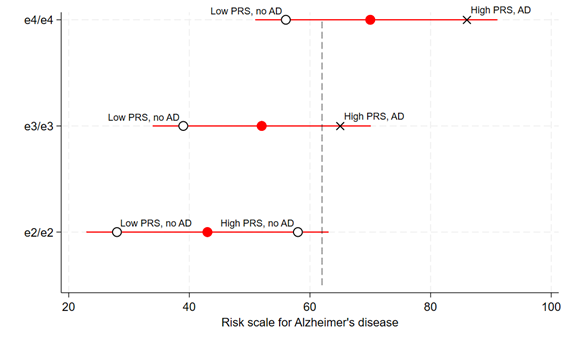
In this sense, it is less accurate to call variation in apoE the cause of most AD and more precise to call it a component (or contributing) cause. There may be other ways by which we could reduce AD incidence aside from interventions targeting apoE’s structure or function, e.g. perhaps by improving education or cardiovascular health in the population. If these are also truly component causes of AD as well, intervening on them would shift individuals down the risk spectrum, and fewer would fall above the threshold for AD. Nonetheless, the fact that there are other factors involved in AD risk does not undermine apoE’s position as the predominant cause of the disease. When a disease is multifactorial, not all its causes are equal in strength or prevalence, and as we have seen, these variants in apoE are both a very strong and very common cause of AD. It is important to realise that without a background of risk from ε3 or ε4 isoforms, at-risk individuals would be placed so much further down the risk spectrum that all other contributing causes would be much less relevant (Figure 2).

Figure 2: Other risk factors for AD are far less relevant without a background of excess risk from ε3 or ε4 genotypes
Overlaying the previous figure are black markers to show individuals within each APOE group with a specific degree of some other contributing cause for AD. For example, depicted here are the average positions of people at the 99% upper and lower centiles of a polygenic risk score (PRS) for AD (not including variation in the APOE gene). Among ε3/ε3 and ε4/ε4 groups, having high or low genetic liability to AD from the PRS contribute to whether an individual will cross the threshold for disease. But among ε2/ε2 individuals, the extent of genetic liability from the PRS has not alone determined whether an individual will meet the threshold. In other words, without the background of risk from ε3 or ε4, the other risk factor is much less relevant. This will likely be the same for other individual causal risk factors for AD. Only a small proportion of ε2/ε2 individuals will develop AD, either due to an extreme single exposure (such as a mutation causing autosomal dominant AD) or rare combinations of various contributing causes.
This scenario is analogous to the role of smoking in lung cancer causation. Lung cancer has many causes beyond tobacco exposure, which include genetic liability (e.g. innate variation in DNA repair efficiency) and probably other environmental exposures like air pollution. Nevertheless, smoking is responsible for the vast majority of lung cancer burden in populations where smoking occurs. If individuals don’t smoke, lung cancer is rare – most non-smokers comfortably tolerate all risks from other sources throughout their lives without meeting the threshold for lung cancer susceptibility. So if we persuade people not to smoke, we prevent most lung cancer. The same will be true of AD with respect to risk from apoE, though the challenge of identifying the necessary interventions here looks more taxing than for public health measures towards smoking deterrence and cessation.
A call to arms
To conclude, AD researchers are in a privileged position where one protein is key to a large fraction of all disease – identifying how to obviate the ill effects of apoE is a single research avenue that holds vast scope for enabling AD prevention and possibly improving treatment of cases too. This potential advantage is not observed for many common, complex diseases such as coronary heart disease, where its various component causes are individually much more modest than apoE clearly is for AD. Unfortunately, in the preceding three decades, nowhere near proportionate attention or funding has been given to apoE, since the field has focused on other priorities. As a result, among therapeutics currently being trialled in humans for AD, only one directly targets apoE – less than 1% of the late-stage drug development pipeline.7 However, any major progress towards AD prevention may well elude us unless apoE becomes the focal point for our efforts, so it is time to revise our priorities. For most AD, it is inaccurate to say that its causes remain unknown: the most important cause by far is clear and we need to understand how to modify it.
If you have issues or questions about this research… please see a lengthy FAQs document posted on my github page at: https://github.com/dylwil/ad_apoe_paf. Or contact me with queries by email at dylan.williams@ucl.ac.uk
References
- Williams DM, Davies NM, Anderson EL. The proportion of Alzheimer’s disease attributable to Apolipoprotein E. medRxiv. 2023:2023.11.16.23298475. doi:10.1101/2023.11.16.23298475
- Belloy ME, Andrews SJ, Le Guen Y, et al. APOE genotype and Alzheimer disease risk across age, sex, and population ancestry. JAMA neurology. 2023;80(12):1284-1294.
- Genin E, Hannequin D, Wallon D, et al. APOE and Alzheimer disease: a major gene with semi-dominant inheritance. Molecular psychiatry. 2011;16(9):903-907.
- Reiman EM, Arboleda-Velasquez JF, Quiroz YT, et al. Exceptionally low likelihood of Alzheimer’s dementia in APOE2 homozygotes from a 5,000-person neuropathological study. Nature Communications. 2020/02/03 2020;11(1):667. doi:10.1038/s41467-019-14279-8
- Ashford JW. APOE genotype effects on Alzheimer’s disease onset and epidemiology. Journal of Molecular Neuroscience. 2004;23:157-165.
- Raber J, Huang Y, Ashford JW. ApoE genotype accounts for the vast majority of AD risk and AD pathology. Neurobiology of aging. 2004;25(5):641-650.
- Cummings J, Zhou Y, Lee G, Zhong K, Fonseca J, Cheng F. Alzheimer’s disease drug development pipeline: 2023. Alzheimer’s & Dementia: Translational Research & Clinical Interventions. 2023;9(2):e12385.

Dr Dylan Williams
Author
Dr Dylan Williams is a Principle Research Fellow at University College London. By day Dylan is a molecular epidemiologist investigating the causes of neurodegenerative diseases. Outside work, he is dad to two young children, so he no longer have hobbies. However, he does read spent many hours listening to music and creating playlists & trail running (but only if the weather is nice).

 Print This Post